Work done on a gas
Pressure work
To apply the first law of thermodynamics to an ideal gas, we need to know the work done on the gas by the environment. Because of the pressure in a gas, work is done when the volume of the gas changes.
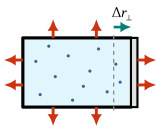
Consider a gas in a sealed container, which exerts a force on the walls of the container. If the volume of the container changes, work is done, since this force is applied to a moving wall.
Derivation: Work done on a gas (optional)
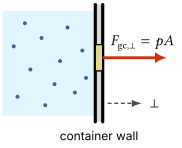
For any small area $A$ of the container wall, the force exerted by the gas on that area is in the direction perpendicular to the wall and outward, and is
\[F_{\mathrm{gc},\perp} = pA,\]where the subscript $\mathrm{gc}$ stands for “gas on container.”
By Newton’s third law, the component of the inward force exerted by the container on the gas is opposite the gas’s force:
\[F_{\mathrm{cg},\perp} = - F_{\mathrm{gc},\perp} = - p A.\]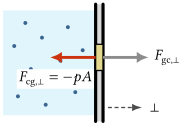
If the wall undergoes a small displacement $\Delta r_{\perp}$ in the direction perpendicular to the wall, then the work done on the gas by the wall is
\[W = F_{\mathrm{cg},\perp} \, \Delta r_{\perp} = - p A \, \Delta r_{\perp}.\]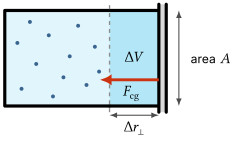
The product $A \, \Delta r_{\perp}$ is the gas’s change in volume $\Delta V$.
Sign convention for work
We find that the work done on the gas for a small volume change $\Delta V$ is
\[W = - p \, \Delta V.\]It’s important to get the sign right in this equation!
- If the wall moves outward, then the gas expands ($\Delta V > 0$). Since the displacement is opposite the inward force of the container on the gas, the work done on the gas is negative ($W < 0$).
- Conversely, if the wall moves inward, the gas is compressed ($\Delta V < 0$), and the work done on the gas is positive ($W > 0$).
Work is the area under a $pV$ curve
We can calculate the total work done in a process by adding up the work done over many small volume changes. In the limit of $\Delta V \to 0$, the work done on the gas is the integral
\[\boxed{W = -\int_{V_i}^{V_f} p \, dV}\]Remember that the integral $\int p \, dV$ is the signed area between the graph of $p(V)$ and the $V$-axis. So we have
\[\boxed{W = -\left(\text{area under the curve in a } pV \text{ diagram}\right).}\]Work in a constant volume process
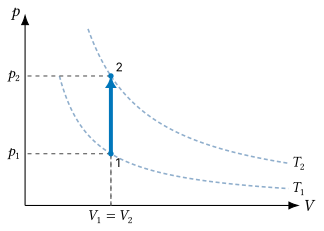
In a constant volume process, because the volume does not change, no work is done on the gas. The $pV$ curve for a constant volume process is a vertical line with no area below the curve.
Work in a constant pressure process
In a constant pressure process, the $pV$ curve is a horizontal line, and the region under the curve is a rectangle.
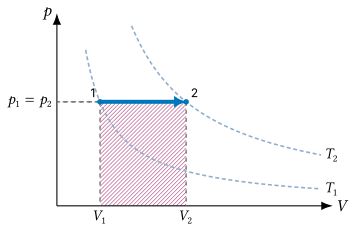
We can calculate the work as minus the signed area under this line. Note that the area has a sign depending on the direction of the process: the area is positive for expansion and negative for compression.
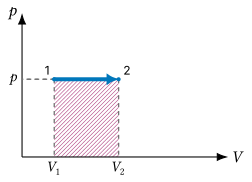
Expansion: the area under the curve is positive, so $W < 0$.
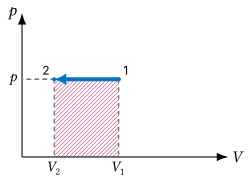
Compression: the area under the curve is negative, so $W > 0$.
When calculating the work done in a constant pressure process, $p$ is constant, so we can pull it out of the integral:
\[W = -\int_{V_i}^{V_f} p \, dV = -p \int_{V_i}^{V_f} dV = -p \left( V_f - V_i \right) = -p \, \Delta V\]The work done on a gas in a constant pressure process is
\[\boxed{W = -p \, \Delta V,}\]which is minus the area of the rectangle under the $pV$ curve.
Work in an isothermal process
For an isothermal process, we can calculate the work by finding the area under the isotherm given by $p = nRT/V$ between the initial and final volumes.
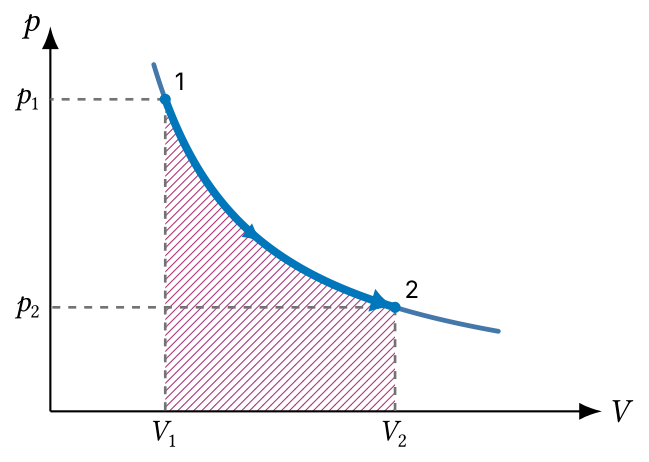
Plugging this into the expression for work, we get
\[W = -\int_{V_i}^{V_f} p \, dV = -\int_{V_i}^{V_f} \frac{nRT}{V} \, dV = -nRT \int_{V_i}^{V_f} \frac{1}{V} \, dV = -nRT \left[ \ln V \right]_{V_i}^{V_f}\]We find that the work done on the gas in an isothermal process is
\[\boxed{W = -nRT \ln\left(\frac{V_f}{V_i}\right).}\]Example: Work along two paths
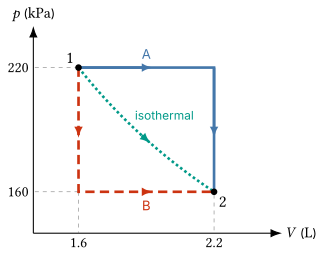
A sample of $0.15\ \mathrm{mol}$ of nitrogen gas is in a sealed container with a movable piston. The gas initially occupies volume $V_1 = 1.6\ \mathrm{L}$ at a pressure of $p_1 = 220\ \mathrm{kPa}$. Consider the following two processes:
- (A) the gas expands at constant pressure to a volume of $V_2 = 2.2\ \mathrm{L}$, then is cooled at constant volume until it reaches pressure $p_2 = 160\ \mathrm{kPa}$.
- (B) the gas is cooled at constant volume to the same final pressure $p_2 = 160\ \mathrm{kPa}$, then expands at constant pressure to the final volume $V_2 = 2.2\ \mathrm{L}$.
Try parts (a) and (b) yourself first:
- (a) Draw a $pV$ diagram showing both paths (A) and (B).
- (b) Do these two states fall on the same isotherm?
- (c) Calculate the work done on the gas along each path.
- (d) How much work would be done in an isothermal process connecting these same two states?
Solution
(a) Path A runs right along $p_1$, then down to state 2. Path B runs down to $p_2$, then right to state 2. The diagram also shows the isotherm through both states, found in part (b) and used in part (d).
(b) Two states lie on the same isotherm if they have the same temperature. Converting to SI units,
\[\begin{aligned} V_1 &= 1.6\times 10^{-3}\ \mathrm{m^3}, & p_1 &= 220\times 10^{3}\ \mathrm{Pa}, \\ V_2 &= 2.2\times 10^{-3}\ \mathrm{m^3}, & p_2 &= 160\times 10^{3}\ \mathrm{Pa}. \end{aligned}\]The container is sealed, so $n$ stays fixed. Solving the ideal gas law $pV = nRT$ for the temperature gives $T = pV/nR$, so
\[\begin{aligned} T_1 &= \frac{p_1 V_1}{nR} = \frac{(220\times 10^{3}\ \mathrm{Pa})(1.6\times 10^{-3}\ \mathrm{m^3})}{(0.15\ \mathrm{mol})(8.314\ \mathrm{J/(mol\cdot K)})} = 282\ \mathrm{K}, \\ T_2 &= \frac{p_2 V_2}{nR} = \frac{(160\times 10^{3}\ \mathrm{Pa})(2.2\times 10^{-3}\ \mathrm{m^3})}{(0.15\ \mathrm{mol})(8.314\ \mathrm{J/(mol\cdot K)})} = 282\ \mathrm{K}. \end{aligned}\]The two temperatures match, so both states lie on the same isotherm, at $T = 282\ \mathrm{K}$.
(c) No work is done on the gas during a constant-volume step, since $\Delta V = 0$. Each path does work only in its constant-pressure step, where $W = -p\,\Delta V$.
Path A expands at $p_1$:
\[\begin{aligned} W_A &= -p_1 \left(V_2 - V_1\right) \\ &= -(220\times 10^{3}\ \mathrm{Pa})(2.2\times 10^{-3}\ \mathrm{m^3} - 1.6\times 10^{-3}\ \mathrm{m^3}) = \boxed{-132\ \mathrm{J}}. \end{aligned}\]Path B expands at $p_2$:
\[\begin{aligned} W_B &= -p_2 \left(V_2 - V_1\right) \\ &= -(160\times 10^{3}\ \mathrm{Pa})(2.2\times 10^{-3}\ \mathrm{m^3} - 1.6\times 10^{-3}\ \mathrm{m^3}) = \boxed{-96\ \mathrm{J}}. \end{aligned}\]Both works are negative because the gas expands along each path. Path A expands at the higher pressure, so the gas does more work on its surroundings: $W_A$ is more negative than $W_B$.
(d) Part (b) showed that both states lie on the isotherm at $T_1 = 282\ \mathrm{K}$. The work done on the gas in an isothermal process is
\[W = -nRT_1 \ln\left(\frac{V_2}{V_1}\right).\]Since $nRT_1 = p_1 V_1$, we can write this as
\[\begin{aligned} W &= -p_1 V_1 \ln\left(\frac{V_2}{V_1}\right) \\ &= -(220\times 10^{3}\ \mathrm{Pa})(1.6\times 10^{-3}\ \mathrm{m^3}) \ln\left(\frac{2.2\ \mathrm{L}}{1.6\ \mathrm{L}}\right) = \boxed{-112\ \mathrm{J}}. \end{aligned}\]The isotherm lies between paths A and B on the $pV$ diagram, so its work falls between $W_A$ and $W_B$. The three processes join the same two states but do different amounts of work: work depends on the path.
Path functions vs. state functions
The example above illustrates an important point: the work done on a gas depends on the process connecting the initial and final states. Knowing only the initial and final states is not enough to determine the work done on a gas.
We call a quantity that depends on the path between two states a path function. Both work and heat are path functions.
In contrast, the internal energy of an ideal gas depends only on the temperature, so it is determined by the state of the system. A quantity that only depends on the state of the system is called a state function. The change in a state function (like $\Delta E_{\mathrm{int}}$) only depends on the initial and final states, and not the specific process connecting them.