The ideal gas model
To explore the first law of thermodynamics in more detail, it will be helpful to consider a simple model system. The simplest thermodynamic system is a gas of non-interacting particles, which we call an ideal gas. Although the ideal gas model is an idealization, it works as a good approximation to the behavior of real gases under many conditions, especially when the density of the gas is low.
The state of a gas
The state of a thermodynamic system is specified by a set of macroscopic variables, such as pressure, volume, and temperature, that completely determine the observable properties of the system. For an ideal gas, the state variables are:
- Pressure $p$
- Volume $V$
- Temperature $T$
- Mole number $n$ (or number of particles $N$)
We will always consider a gas in a sealed container, meaning the number of particles $N$ or moles $n$ of gas is fixed, and only $p$, $V$, and $T$ can change.
Pressure
The pressure $p$ of a gas is the force per unit area that the gas exerts on any surface in contact with it, such as the walls of its container:
\[p = \frac{F_{\perp}}{A}.\]The subscript $\perp$ (meaning perpendicular) is a reminder that the force due to the pressure always acts perpendicular to a surface.
Pressure is a form of stress or force per unit area, like the tensile stress you saw in Physics 5A. The SI unit of stress is the pascal ($\mathrm{Pa}$):
\[1\ \mathrm{Pa} = 1\ \mathrm{N/m^2}.\]One pascal is a very small pressure. The air around you at sea level is at atmospheric pressure, also called one atmosphere ($1\ \mathrm{atm}$):
\[\boxed{p_{\mathrm{atm}} = 101.3\ \mathrm{kPa}.}\]Moles and molecules
We can measure the amount of gas either by the number of molecules $N$ or by the number of moles $n$. Recall that the number of moles of a substance is related to the number of molecules by the Avogadro constant $N_A$:
\[n = \frac{N}{N_A},\]where $N_A \approx 6.022\times 10^{23}\ \mathrm{mol^{-1}}$.
The ideal gas law
The state variables in a gas are not all independent. For example, consider air sealed in a balloon. Since the balloon is flexible, the gas stays at approximately atmospheric pressure even as the other variables change. If we heat the gas in the balloon, the balloon will expand and the volume will increase.
By conducting experiments that keep one variable fixed while changing another, we learn that the state variables of an ideal gas are related by the ideal gas law (IGL):
\[\boxed{pV = nRT}\]where $R$ is the gas constant, with value
\[R = 8.31\ \mathrm{J/(mol\cdot K)}.\]In chemistry classes, you may have encountered the gas constant with units of $\mathrm{atm}\cdot\mathrm{L}$ instead of $\mathrm{J}$. We will always use SI units in this course.
Molecular form of the ideal gas law
There is an equivalent form in terms of the number of molecules $N$. Plugging $n = N/N_A$ into the ideal gas law $pV = nRT$, we get
\[pV = \left( \frac{N}{N_A} \right) RT.\]The combination $R/N_A$ is the Boltzmann constant $k_B$:
\[k_B = \frac{R}{N_A} = 1.38\times 10^{-23}\ \mathrm{J/K}.\]Writing the ideal gas law in terms of the number of molecules $N$ and the Boltzmann constant $k_B$, we get the molecular form of the ideal gas law
\[\boxed{pV = N k_B T.}\]The combined gas law
Note that since $n$ is fixed, if we rearrange the IGL to
\[\frac{pV}{T} = nR,\]the right-hand side is a constant. This means that we must have
\[\frac{p V}{T} = \text{constant}\]or
\[\boxed{\frac{p_1 V_1}{T_1} = \frac{p_2 V_2}{T_2}}\]for any two states of the gas. This combined gas law is equivalent to the ideal gas law for our purposes.
Processes and $pV$ diagrams
Ideal gas processes
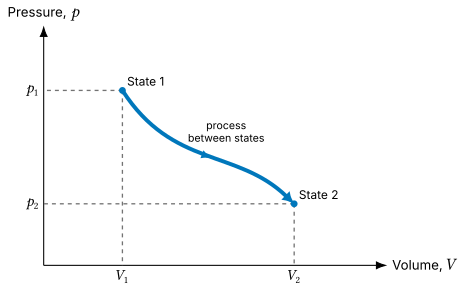
Consider a process that changes the state of an ideal gas, like heating a gas in a container, or compressing a gas with a piston. In general, all three of the state variables $p$, $V$, and $T$ can change during such a process.
However, the combined gas law tells us that we only need to know how any two of the state variables change to determine how the third changes. For example, if we know how $p$ and $V$ change, we can determine how $T$ changes.
This means that we can represent a process as a path in a two-dimensional plot of any two state variables. The most common choice is a graph of pressure $p$ versus volume $V$, which we call a $pV$ diagram.
Special named processes
In general, a process can be any path in the $pV$ plane connecting two states. However, there are some special cases that have been given names:
- An isothermal process, in which the temperature $T$ is held constant.
- A constant volume (or isochoric) process, in which the volume $V$ is held constant.
- A constant pressure (or isobaric) process, in which the pressure $p$ is held constant.
- An adiabatic process, in which no heat is transferred into or out of the gas ($Q = 0$).
Isothermal processes
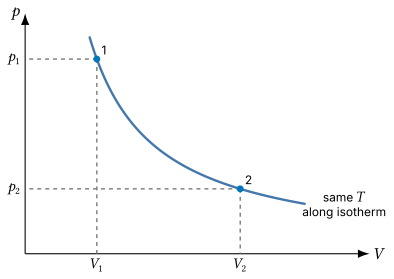
In an isothermal process, the temperature $T$ is held constant. Because the internal energy of an ideal gas depends only on temperature, this means that the internal energy does not change during an isothermal process.
From the ideal gas law, we have
\[p = \frac{nRT}{V}.\]If $T$ is constant, then $nRT$ is a constant, so we have
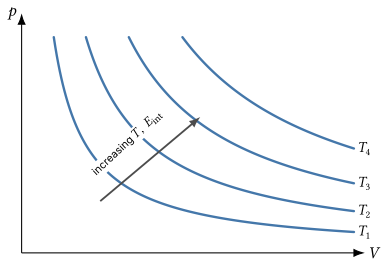
\[p \propto \frac{1}{V}.\]This relationship describes a hyperbola in the $pV$ plane, so the path traced out by an isothermal process on a $pV$ diagram is a hyperbolic curve. These constant temperature curves are called isotherms. Along any isotherm, the internal energy of the gas is constant.
Isotherms as curves of constant internal energy
Increasing pressure or volume gives a state on a higher temperature isotherm, which also means greater internal energy.