Application: molecular energy
Energy diagrams are not just a tool for blocks and springs. One of the most useful applications is to the interaction between two atoms in a molecule. Consider the following energy diagram, which shows a model for the interaction between two atoms in a diatomic molecule (for example, CO or N₂).
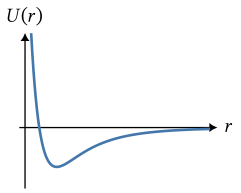
The coordinate $r$ is the distance between the atoms. We choose to set the potential energy $U = 0$ when the atoms are separated infinitely far apart ($r \to \infty$).
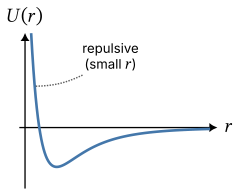
Recall that the force is minus the slope of the potential energy curve. Reading the two branches of the curve tells us how the atoms interact at different separations. When the atoms are close together (small $r$), the interaction is repulsive.
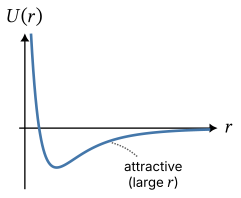
When the atoms are farther apart (large $r$), the interaction is attractive.
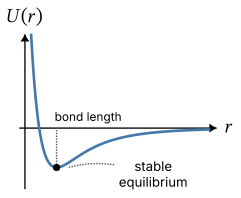
In between, the interaction has a point of stable equilibrium at the bond length of the molecule.
Bound and unbound molecules
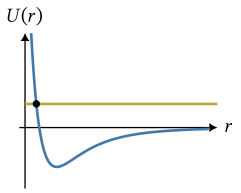
The minimum energy the molecule needs in order for the atoms to completely separate is $E_\mathrm{mech} = 0$, since this is the potential energy when the atoms are very far apart.
If the total mechanical energy is less than zero, the atoms cannot separate. Since there is a maximum distance between the atoms, the molecule is bound.
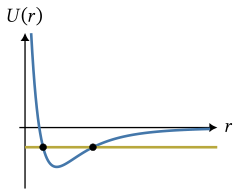
Since the molecule sits near a stable equilibrium, a bound molecule oscillates just like a mass on a spring or a pendulum.
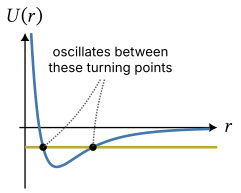
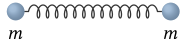
This means we can model the atoms in a molecule as being connected by microscopic springs.
If the energy is greater than zero, the molecule is no longer bound and can dissociate.
Ground state energy and bond energy
The minimum energy the molecule can have is called the ground state energy. For quantum-mechanical reasons, the molecule cannot sit exactly at rest at the equilibrium point. In the ground state, it still vibrates slightly about the bond length.
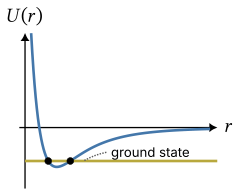
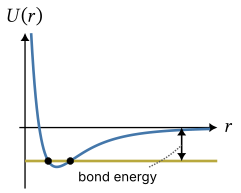
The energy needed to separate the molecule from its ground state is called the bond energy.
Chemical energy
The greater the bond energy, the more stable the molecule.
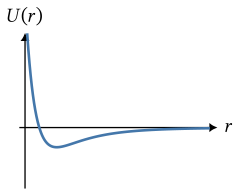
Lower bond energy $\Rightarrow$ less stable bond.
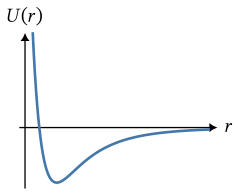
Greater bond energy $\Rightarrow$ more stable bond.
Energy is not stored in chemical bonds — a bound system always has lower energy than an unbound system. However, a reaction that takes a system from a less stable state to a more stable state releases energy.
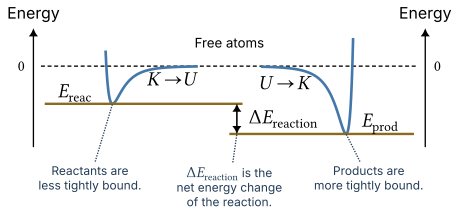
When a macroscopic number of chemical reactions take place, we call the total energy released or absorbed by the system a change in chemical energy $\Delta E_\mathrm{chem}$.
For example, combustion of one glucose molecule releases about $5 \times 10^{-18}\ \mathrm{J}$. The chemical energy released by combusting $1\ \mathrm{mol}$ of glucose is
\[|\Delta E_\mathrm{chem}| \approx 2800\ \mathrm{kJ}.\]Energy in the body
One thing that makes energy conservation so powerful is that we can use it even for systems whose microscopic details are very complicated, like living organisms. Consider a simple model of the body: energy enters, is stored and transformed internally, and leaves as thermal energy or as work done on the environment.
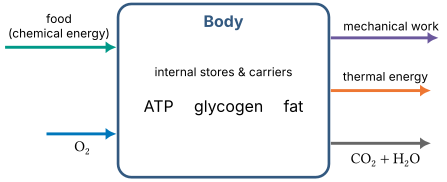
Chemical energy from food
The energy input to the body comes from food. In metabolism, carbohydrates, proteins, and fats are transformed into lower-energy products.
For example, consider oxidation of glucose. The net reaction is the same as combustion, although the body releases the energy through many controlled steps:
\[\mathrm{C_6H_{12}O_6 + 6\,O_2 \longrightarrow 6\,CO_2 + 6\,H_2O}, \qquad |\Delta E_\mathrm{chem}| \approx 2.8\ \mathrm{MJ/mol}.\]The products $\mathrm{CO_2}$ and $\mathrm{H_2O}$ are lower-energy chemical states than glucose and oxygen, so the reaction releases energy.
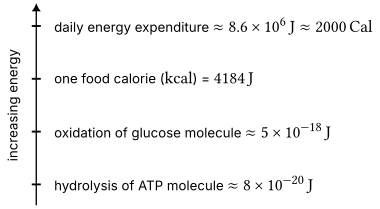
The energy changes at the scale of individual molecules are tiny, but metabolism involves enormous numbers of molecules. Some useful scales for reference:
Macronutrient energy density
Different macronutrients release different amounts of chemical energy per gram:
| Macronutrient | Energy / g ($\mathrm{kJ}$) | Energy / g ($\mathrm{kcal}$) |
|---|---|---|
| Protein | $17$ | $4$ |
| Carbohydrate | $17$ | $4$ |
| Fat | $37$ | $9$ |
Fat releases more energy per gram because it starts farther from the low-energy products $\mathrm{CO_2}$ and $\mathrm{H_2O}$. Fat molecules contain relatively little oxygen already (compare glucose $\mathrm{C_6H_{12}O_6}$ to, e.g., palmitic acid $\mathrm{C_{16}H_{32}O_2}$).
ATP and energy storage
At the cellular level, the body usually does not use the chemical energy in food directly. Instead, energy is transferred through ATP.
- Hydrolyzing one ATP molecule to ADP releases about $8 \times 10^{-20}\ \mathrm{J}$, the energy scale of molecular processes such as ion pumps, protein synthesis, and muscle contraction.
- A cell stores only a small amount of ATP at one time, so ATP is continually regenerated from ADP using energy from food. Larger energy reserves are stored as glycogen and as fat.
Metabolic power
How fast does the body use energy? As an order-of-magnitude estimate, the basal metabolic rate (BMR) is about $100\ \mathrm{W}$. This is the power required to maintain basic bodily functions at rest.
This means that, at rest, the body transforms roughly $100\ \mathrm{J}$ of chemical energy every second. Over one day,
\[\left(100\ \tfrac{\mathrm{J}}{\mathrm{s}}\right)\!\left(8.64 \times 10^{4}\ \tfrac{\mathrm{s}}{\mathrm{day}}\right) \approx 8.64\ \tfrac{\mathrm{MJ}}{\mathrm{day}} \approx 2000\ \tfrac{\mathrm{Cal}}{\mathrm{day}}.\]Even at rest, maintaining ion gradients, running organs, and replacing molecules all require continuous power. Most of that energy eventually leaves as thermal energy.
Physical activity adds to the metabolic power. The additional energy expenditure depends on the type and intensity of the activity. You can find many values for various activities tabulated in your favorite exercise physiology textbook. For example, a $73\ \mathrm{kg}$ person walking on level ground at $3\ \mathrm{mph}$ expends about $4.4\ \mathrm{kcal/min}$ above their BMR.
To estimate metabolic power output (for aerobic metabolism), we can measure oxygen consumption as a proxy. About $20\ \mathrm{kJ}$ of chemical energy is released per liter of $\mathrm{O_2}$ consumed.
Mechanical efficiency
Earlier we saw that the body converts food chemical energy into mechanical work with an efficiency of about $e \approx 0.25$. The other ${\sim}75\%$ ends up mostly as thermal energy. If $e = 0.25$, then for every joule of mechanical work the body delivers,
\[\Delta E_\mathrm{th} \approx 3\,|\Delta E_\mathrm{mech}|.\]This is why vigorous exercise warms the body. High metabolic power also means high thermal energy generation.
Choosing a system that includes the body
Now that we have a model of the body as a physical system with energy inputs and outputs, we can include the body in our energy bookkeeping.
For example, consider the process of lifting a book from rest and placing it on a shelf. The energy bookkeeping changes depending on our choice of system.
Book alone. The lifting work is balanced by the work done by gravity:
\[\Delta E_\mathrm{sys} = W_\mathrm{lift} + W_g = 0.\]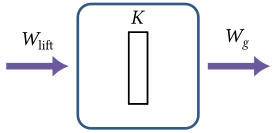
Book + Earth. The lifting work increases the gravitational potential energy:
\[\Delta U_g = W_\mathrm{lift}.\]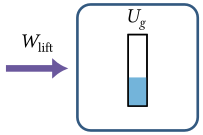
Check your understanding: Now include the person lifting the book along with the book and Earth. What does the energy accounting look like in this case? Draw an energy bar chart for the system.
Answer
There is no external force on the system. The energy used to lift the book comes from chemical energy in the body, which is transformed into gravitational potential energy and thermal energy:
\[\Delta E_\mathrm{chem} + \Delta U_g + \Delta E_\mathrm{th} = 0.\]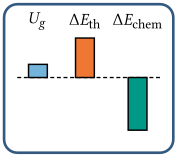
The big picture
What have we learned?
I hope you come away from this class with a better understanding of physics — but more importantly, with a clearer idea of what learning and doing physics is like. Going a step further, my ultimate goal is for you to leave this class with an expanded view of what you are capable of.
A few themes ran through everything we did:
- We can understand many complicated phenomena using simplified mathematical models.
- Even though the models are “simple” compared to the real world, the process of applying them may not be. Physics is not just about finding the right formula and plugging in!
- Most of what we did in this class comes down to modeling interactions between systems — either through forces or through energy.
What does this process actually look like?
- Represent the physical situation. Draw pictures, choose coordinates, define your system.
- Plan your approach. What is your strategy? What do you know? What do you need?
- Execute your plan. Write down equations, do the algebra.
- Reflect on your result. (Don’t forget this step!) Does your answer make sense? Is there another way to think about the problem? What can you learn from your process?