Potential energy and force
Potential energy and force are equivalent ways of describing interactions. If we know the potential energy of a system in every configuration, we can determine the interaction forces between the objects in the system.
Recall that the work done by a conservative force is minus the change in the potential energy for that force:
\[W = -\Delta U.\]For one-dimensional motion, the work done by a force $\vec{F}$ is
\[W = \int_{x_i}^{x_f} F_x(x)\,dx.\]Combining these two equations, we find that the change in potential energy associated with a force is
\[\Delta U = -\int_{x_i}^{x_f} F_x(x)\,dx.\]The fundamental theorem of calculus then tells us that the $x$-component of the force is
\[\boxed{F_x = -\frac{dU}{dx}}\]In terms of a graph of the potential energy, this means
\[F_x = -\left(\text{slope of } U \text{ vs. } x \text{ graph}\right).\]So if we know the potential energy of a system as a function of position, or equivalently if we have a graph of the potential energy, then the force is fully determined. In particular, the relationship $F_x = -dU/dx$ tells us that
\[\boxed{\text{conservative forces act in the direction of decreasing potential energy.}}\]Intuitively, forces tend to point “downhill” in a potential energy graph.
Energy diagrams
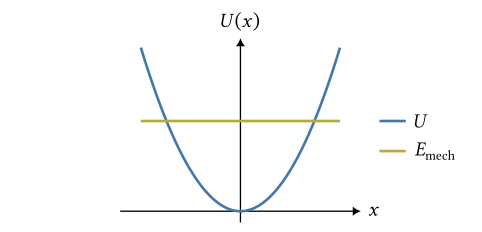
An energy diagram is a graph of potential energy, typically plotted along with a horizontal line representing the total mechanical energy $E_\mathrm{mech}$ of the system. For example, here is an energy diagram for a mass attached to a spring, where the potential energy is the parabola $U(x) = \frac{1}{2}kx^2$:
The total mechanical energy is the sum of the (macroscopic) kinetic and potential energies:
\[E_\mathrm{mech} = K + U.\]For an isolated system with no dissipative forces, the total mechanical energy is constant: $\Delta E_\mathrm{mech} = 0$.
Given an energy diagram, we can find the kinetic energy at any point by subtracting the potential energy from the total mechanical energy:
\[K = E_\mathrm{mech} - U.\]Here is the same energy diagram as before, but with a curve added showing the kinetic energy $K = E_\mathrm{mech} - U$ as a function of position:
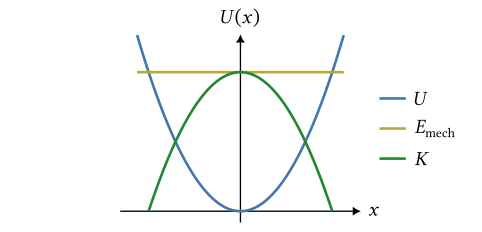
For the mass on a spring, the kinetic energy is largest at the center of the parabola (where $U$ is smallest) and shrinks to zero where the potential energy curve rises up to meet the total energy line.
Turning points
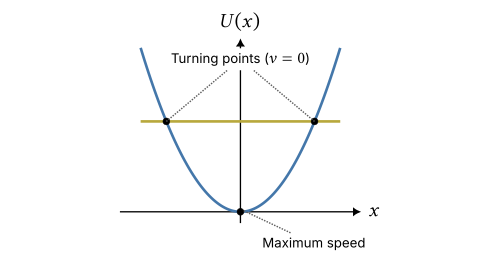
We can use an energy diagram to find turning points of the motion. Recall that a turning point is where the speed is zero: the particle stops and changes direction.
Since $v = 0$ at a turning point, the kinetic energy is zero. So turning points are the points at which
\[\boxed{U(x) = E_\mathrm{mech}}\]On an energy diagram, the turning points occur where the horizontal total energy line intersects the potential energy graph:
Forbidden regions
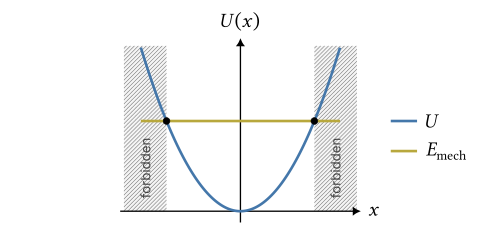
Since the kinetic energy can never be negative, the potential energy at a point sets the lower limit for the total mechanical energy. Any region where $U(x) > E_\mathrm{mech}$ is forbidden: the particle does not have enough energy to reach it. The motion stays in the allowed region between the turning points, as shown below.
Equilibrium and stability
An energy diagram also tells us about points where a particle is in equilibrium. Recall that for a particle, equilibrium means the net force is zero. Assuming the net force $\vec{F}$ on the system is conservative, we can write the force in terms of the potential energy $U$ as $F_x = -dU/dx$. So at equilibrium, we have
\[\boxed{\frac{dU}{dx} = 0}\]This means that points at which a particle is in equilibrium are critical points of the potential energy. If we place a particle at rest at one of these positions, it will stay there indefinitely as long as no other forces act on it.
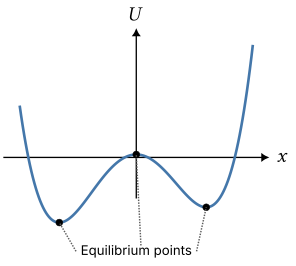
An equilibrium may be stable or unstable:
- At a stable equilibrium, the system tends to move back to equilibrium if we displace it slightly. Think about a pendulum, or a mass on a spring.
- At an unstable equilibrium, the system accelerates away from equilibrium if we displace it slightly. Think about a ball balanced on top of a hill.
We can identify stable and unstable equilibrium points by looking for minima and maxima of the potential energy:
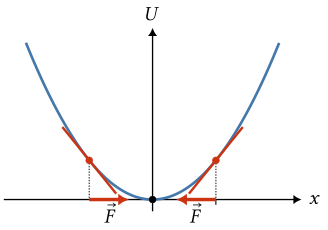
- A minimum in potential energy is a point of stable equilibrium. If we move away from the equilibrium point, the force is directed back toward equilibrium (a restoring force). Remember: the force points “downhill” in a potential energy graph.
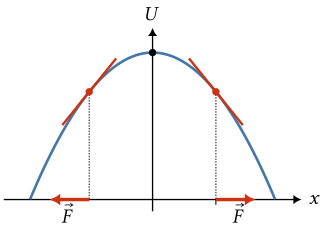
- A maximum in potential energy is a point of unstable equilibrium. If we move the system away from the equilibrium point, the force is directed away from equilibrium.
Application: pendulum motion
Consider a pendulum formed by attaching a mass $m$ to a rigid bar of length $L$. The pendulum is free to rotate in a vertical circle about a fixed pivot.
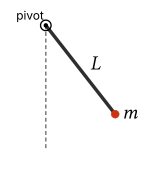
The pendulum mass moves in non-uniform circular motion, and we can measure its position using the angle $\theta$ of the bar from the vertical.
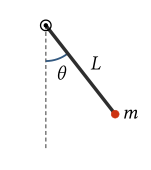
The reason we’re considering a rigid bar is to allow the pendulum to swing above the horizontal without worrying about the string going slack.
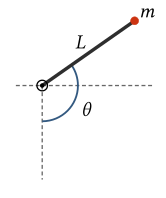
If we set $U = 0$ when the pendulum is at its lowest point, then the gravitational potential energy of the pendulum mass is
\[\begin{aligned} U &= mgh\\ &= mgL(1 - \cos\theta). \end{aligned}\]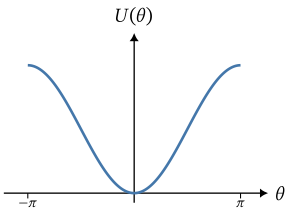
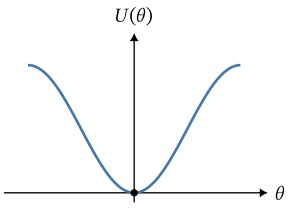
Check your understanding: Where are the points of stable and unstable equilibrium? How would you describe the state of the pendulum at each of these points?
Answer
At $\theta = 0$, the potential energy has a minimum. This is a stable equilibrium: the mass hangs straight down below the pivot, and a small displacement produces a restoring torque back toward the bottom.
\[\boxed{\theta = 0 \text{ is stable equilibrium}.}\]At $\theta = \pm 180^\circ$, the potential energy has a maximum. This is unstable equilibrium: the mass is balanced directly above the pivot, and a small displacement produces a torque that makes the pendulum fall away from the top.
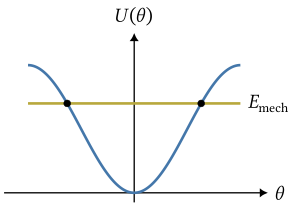
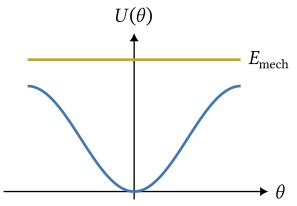
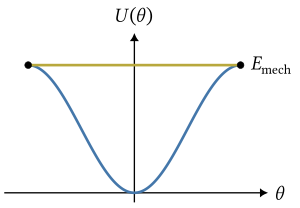
\[\boxed{\theta = \pm 180^\circ \text{ is unstable equilibrium}.}\]Check your understanding: What motion does the pendulum have in each of the following three energy diagrams?
(a)
(b)
(c)
Answer
In an energy diagram, the kinetic energy is
\[K = E_\mathrm{mech} - U.\]The motion is allowed only where $E_\mathrm{mech} \ge U$, and turning points occur where $U = E_\mathrm{mech}$.
(a) The total energy line intersects the potential energy curve at two angles. These are turning points, so the pendulum oscillates back and forth between them. The speed is zero at the turning points and largest at the bottom, where $U$ is smallest.
\[\boxed{\text{The pendulum oscillates between two turning angles}.}\](b) The total energy is above the maximum value of $U$. There are no turning points, so the pendulum has enough energy to rotate all the way over the top.
\[\boxed{\text{The pendulum makes full rotations}.}\](c) The total energy is exactly equal to the maximum value of $U$. This is the critical case: the pendulum just reaches the upright position with zero speed. With exactly this energy, it approaches the top with vanishing speed; any small change in energy or disturbance changes whether it falls back or rotates over the top.
\[\boxed{\text{The pendulum just barely reaches the upright position}.}\](One interesting feature of this case is that it theoretically takes an infinite amount of time to reach the top, because the speed approaches zero as it gets there.)
Example: Particle in a cubic potential
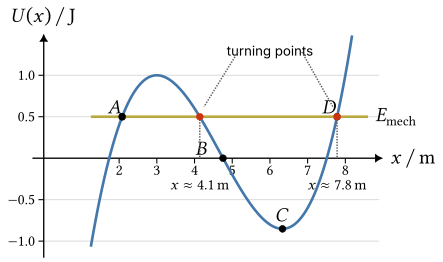
A single conservative force $\vec{F}$ acts on a particle with mass $2.0\ \mathrm{g}$ moving along the $x$-axis. The potential energy function $U(x)$ for this force is plotted below as a function of $x$.
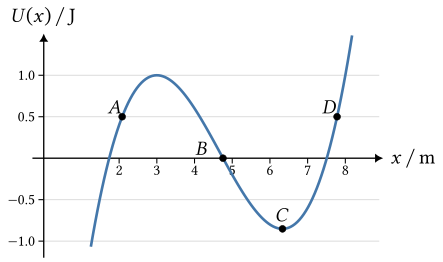
(a) At each of the four labeled points, determine the direction (left or right) of the force on the particle.
(b) If the particle is released at point D at rest, estimate the turning points of the particle’s motion. Where does it reach its maximum speed?
(c) Estimate the $x$-component of the force on the particle at point B.
(d) What minimum speed does the particle need at point A in order to reach point D?
Solution
(a) For a one-dimensional conservative force,
\[F_x = -\frac{dU}{dx}.\]The force points “downhill” on the potential energy graph. Therefore:
- At A, the graph slopes upward as $x$ increases, so $dU/dx > 0$ and the force points left.
- At B, the graph slopes downward as $x$ increases, so $dU/dx < 0$ and the force points right.
- At C, the graph has a minimum, so $dU/dx = 0$ and the force is zero.
- At D, the graph slopes upward as $x$ increases, so $dU/dx > 0$ and the force points left.
We can summarize these results in the table below:
| Point | Direction of force ($F_x$) |
|---|---|
| A | Left |
| B | Right |
| C | Zero force |
| D | Left |
(b) If the particle is released at D from rest, then its total mechanical energy is
\[E_\mathrm{mech} = U(D) \approx 0.5\ \mathrm{J}.\]The turning points occur where $U(x) = E_\mathrm{mech}$. One turning point is D itself:
\[x_D \approx 7.8\ \mathrm{m}.\]Drawing the horizontal line $E_\mathrm{mech} = 0.5\ \mathrm{J}$ across the graph, we see that it intersects the curve again to the right of the local maximum at
\[x \approx 4.1\ \mathrm{m}.\]The particle cannot reach point A in this motion (or any point left of $x \approx 4.1\ \mathrm{m}$), because the potential energy barrier near $x = 3.0\ \mathrm{m}$ is above its total energy.
The speed is largest where the kinetic energy
\[K = E_\mathrm{mech} - U\]is largest. That occurs where $U$ is smallest in the allowed region, at point C:
\[\boxed{\text{maximum speed at C, near } x = 6.3\ \mathrm{m}.}\](c) The force is minus the slope of the graph at B. To estimate that slope, we draw the tangent line to the curve at B and take its rise over run: picking any two points $(x_1, U_1)$ and $(x_2, U_2)$ on the tangent line,
\[\frac{dU}{dx}\bigg|_B \approx \frac{\Delta U}{\Delta x} = \frac{U_2 - U_1}{x_2 - x_1}.\]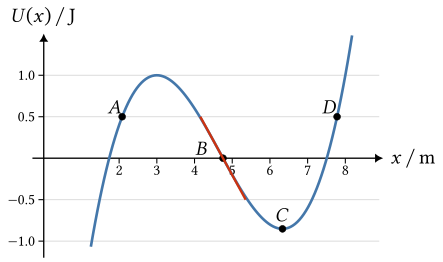
Extending the tangent line to the $U = 0.5\ \mathrm{J}$ and $U = -0.5\ \mathrm{J}$ gridlines makes its endpoints easy to read off from the graph:
\[(x_1, U_1) \approx (4.2\ \mathrm{m},\ 0.5\ \mathrm{J}), \qquad (x_2, U_2) \approx (5.4\ \mathrm{m},\ -0.5\ \mathrm{J}).\]The slope is then
\[\begin{aligned} \frac{dU}{dx}\bigg|_B &\approx \frac{U_2 - U_1}{x_2 - x_1}\\ &= \frac{(-0.5\ \mathrm{J}) - (0.5\ \mathrm{J})}{5.4\ \mathrm{m} - 4.2\ \mathrm{m}}\\ &= \frac{-1.0\ \mathrm{J}}{1.2\ \mathrm{m}}\\ &\approx -0.8\ \mathrm{J/m}. \end{aligned}\]Since $1\ \mathrm{J/m} = 1\ \mathrm{N}$,
\[F_{x,B} = -\frac{dU}{dx}\bigg|_B \approx +0.8\ \mathrm{N}.\]The positive sign means the force points to the right:
\[\boxed{F_{x,B} \approx +0.8\ \mathrm{N}.}\](d) To get from A to D, the particle must pass over the potential energy maximum near $x = 3.0\ \mathrm{m}$. From the graph,
\[U(A) \approx 0.5\ \mathrm{J}, \qquad U_\mathrm{max} \approx 1.0\ \mathrm{J}.\]The minimum speed is the speed that makes the total mechanical energy equal to the top of the barrier:
\[\frac{1}{2}mv_\mathrm{min}^2 + U(A) = U_\mathrm{max}.\]Therefore
\[\begin{aligned} v_\mathrm{min} &= \sqrt{\frac{2\left(U_\mathrm{max} - U(A)\right)}{m}}\\ &= \sqrt{\frac{2\left(1.0\ \mathrm{J} - 0.5\ \mathrm{J}\right)}{0.0020\ \mathrm{kg}}}\\ &= 22\ \mathrm{m/s}. \end{aligned}\]Thus
\[\boxed{v_\mathrm{min} \approx 22\ \mathrm{m/s}.}\]